Shorter Video Ads Among Top Performers In QSR Industry

Max Kalehoff
Key findings
- Video ads 15 seconds or fewer in duration claim the top ten spots in capturing attention among 38 new summer QSR ads.
- Forced-exposure media buys don’t guarantee attentiveness nor quality exposures, so advertisers should manage creative and duration to boost attention outcomes.
- Duration, variety and testing should be primary considerations – not afterthoughts – when developing creatives intended to drive quality exposures and high impact.
The Role of Duration in Capturing Attention
We now live in a digital advertising world where a brand's creative must earn attention to communicate its message. Timing and duration can matter as much as the creative itself because the first few seconds will determine the decay rate of attentive viewing. And making an emotional impact before audience viewership and attention decays can determine how fully a brand communicates its message.
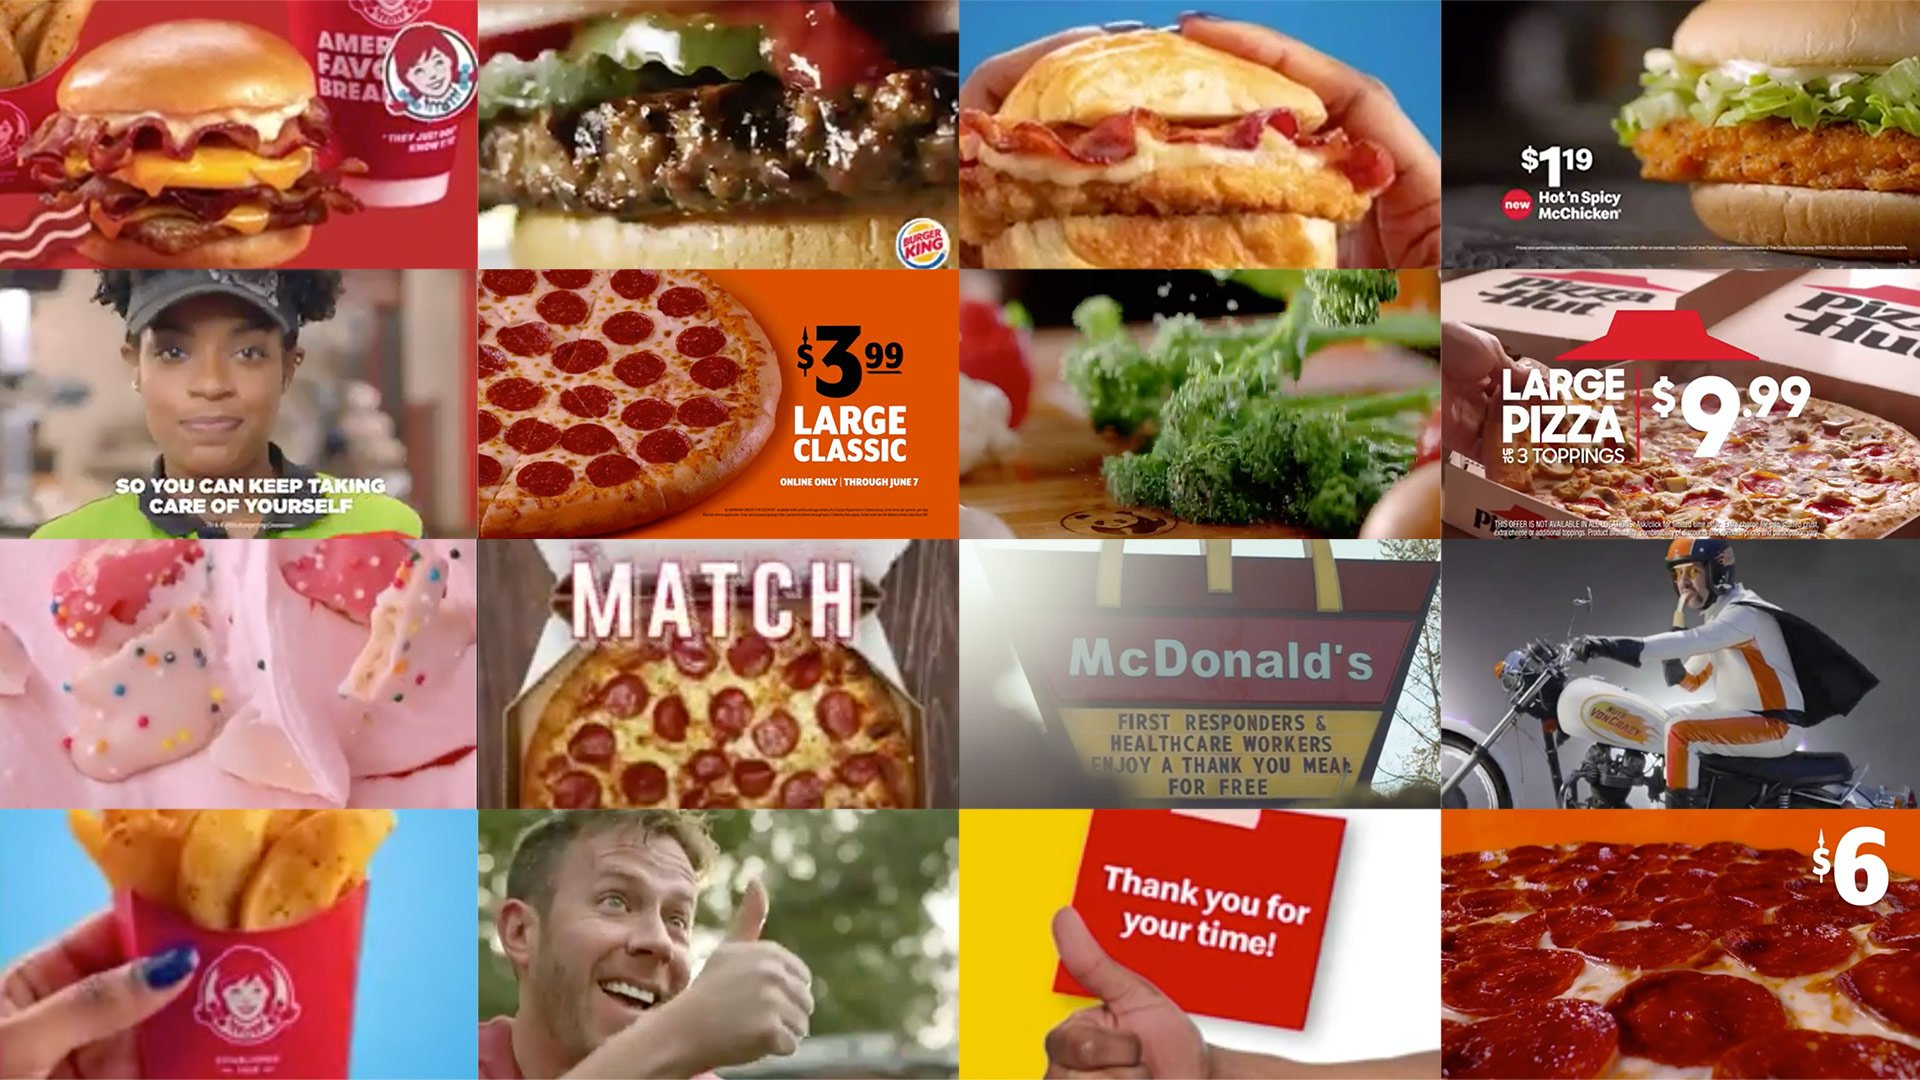
To better understand the relationship of creative duration and attentive ad viewing in the current U.S. climate, we studied 38 video ads among 10 brands in the popular segment of quick-serve restaurants (QSRs). They ranged from 7 to 30 seconds in duration.
Jolted by the COVID-19 pandemic, these establishments are adjusting with a burst of advertising that speaks not only to food cravings, but values of safety protocols, gratitude, takeout and delivery convenience. Equally as much, QSRs are attempting to lure would-be diners with multiple durations of video ads.
Strongest Performers Comprised of Shorter Ads in Sample of New QSR Summertime Ads
In the quest for attention, the shorter duration ads perform better than longer ones in our sample of ads across durations. According to our facial coding study of 38 QSR video ads in the U.S. late June 2020, the top ten ads most likely to capture attention are 15 seconds in duration or less. The top ten ads were distributed across six brands with a variety of creative strategies: Dairy Queen, Burger King, Wendy’s, Taco Bell, Sonic Restaurants and McDonald’s.
Among the eight 30-second ads included in the study, one was in the top third of performers, three in the middle third and four in the bottom third. Our sample size of 38 ads in the QSR industry is not statistically representative of all video ads, however the rankings point to a potential trend worth investigating further.
The analysis relied on the Realeyes Quality Score, which reveals the attention earning power of a creative asset and is predictive of in-market performance. Realeyes measures naturally occurring human response using front-facing cameras as opt-in viewers watch the ads from their PCs, laptops, mobile phones and tablets. The Quality Score, a composite metric from 1-10, factors in best practices for high-performing video ads: the time to first distraction; the audience retention by second 15; and the attention potential indicated by attentiveness and emotional peaks. This study included an average of 164 participant viewers per ad. (See definitions below.)
Quality Score In Focus: Burger King
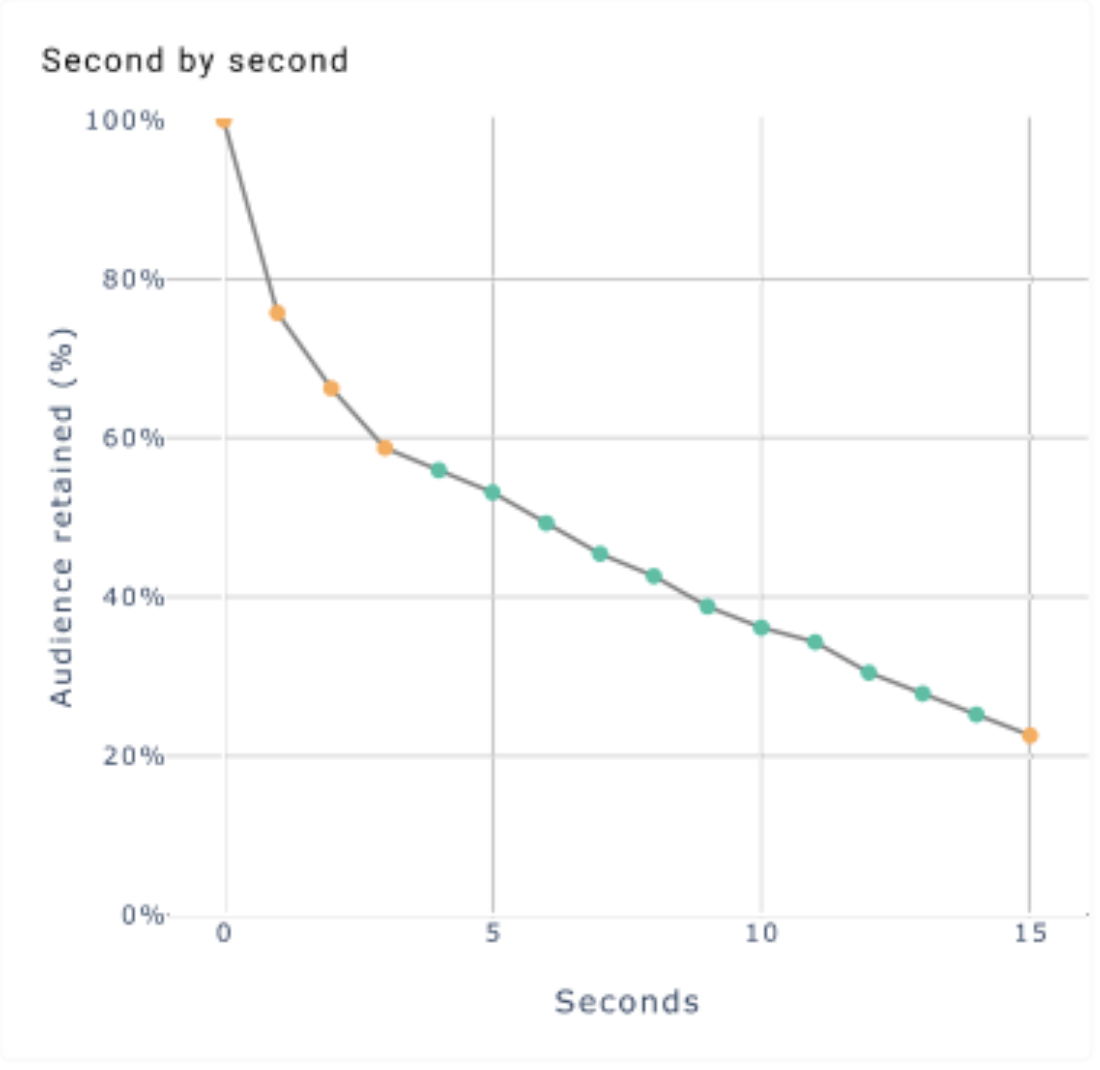
Burger King is notable because its ads included in this study ranked both at the very top and bottom in Quality Score. Realeyes’ audience retention models, which are calibrated to accurately predict in-market video performance, demonstrate the importance of choosing the right creative to hold attention. For example, Burger King’s “Stay Home of The Whopper” 15-second spot, with a Quality Score of 8, had an audience retention prediction of 53% at second five, 36% at second 10, and 23% at second 15. The video’s time to first distraction was 5.8 seconds, and with an Attention Potential score of 87 it scored in the top 20% among its peers for overall attentiveness and engagement.
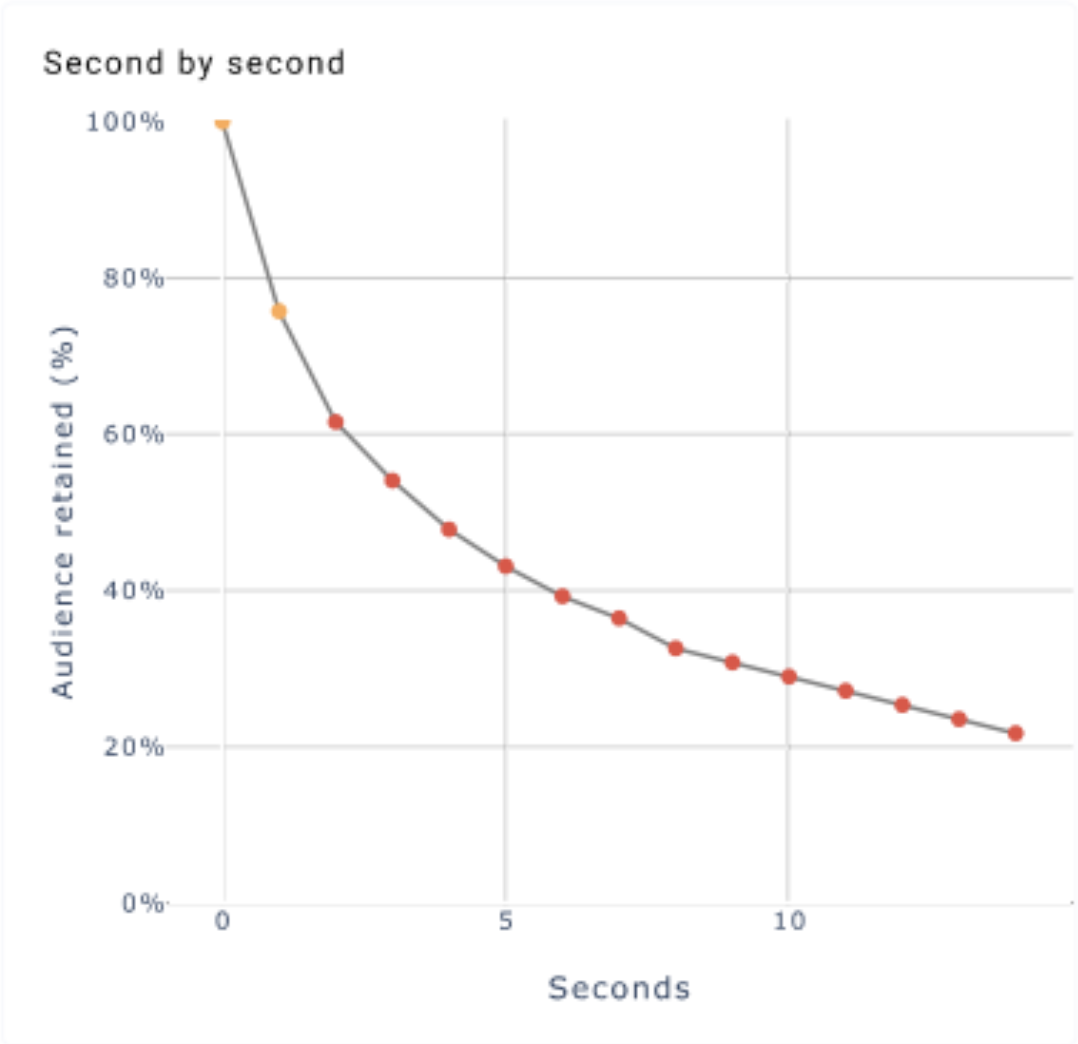
In contrast, Burger King’s “COVID-19 Phase 2 Procedures” 15-second spot had an audience retention prediction of 43% at second 5, 29% at second 10, and 20% at second 15. The time to its first distraction was 3.7 seconds and its Attention Potential of 33 scored it near the bottom third among its peers for overall attentiveness and engagement.
Predicted Audience Retention of Burger King’s “Stay Home of The Whopper” |
Predicted Audience Retention of Burger King’s “COVID-19 Phase 2 Procedures” |
|
|
|
Mandate for Marketers and Publishers: Manage Creative and Duration for Attention Outcomes
Deploy Many Creative Strategies and Formats - Then Test Them: Advertisers with top performing ads inevitably have some low performing ads in their mix, and they are spread across durations and approaches. This underscores the importance of developing and testing many different creative strategies, optimized for different formats and durations. Successful advertising demands finding the best combination of audience, creative, duration and formats across video platforms.
Don’t Assume That Forced-Exposure Media Guarantees Creative Attentiveness: Advertisers running 30-second spots (or any duration) make assumptions about attentive viewing and video completion rates. Yet different creatives behave differently based on the creative and the duration. Digital video platforms like YouTube, Facebook, TikTok, Snap and Twitter understand this and show greater transparency into human attentiveness through viewability and video completion metrics. These digital proxies of human attentiveness are valuable, and facial coding provides an even more complete picture of the ability of creative and duration to earn attention and deliver high-quality exposures.
Keep Your Videos Short: The data point to a best practice: keep your video ads short, less than 15 seconds. This is especially prevalent on digital platforms. Longer cinematic ads may be more likely to win awards on the elite creative circuit. However, disciplined and agile advertising methodologies that employ many variations, often shorter formats, are becoming the performance workhorses of the prominent digital platforms.
Digital Platforms Should Consider Objective Attention Measures to Incentivize Creative Quality: When ad viewing attentiveness is high, it signals a good experience for users. That results in more loyal audiences for platforms to monetize, which then results in more engaging audiences for advertisers to message. Platforms and publishers should adopt objective, reliable and prescriptive measures of quality as a means to incentivize better advertising creative and performance. This is an untapped opportunity to achieve a win-win-win outcome.
Summertime 2020 QSR Video AdsDistribution of Ads By Duration & Realeyes Quality ScoreU.S. General Population SampleTested June 17-24, 2020 |
||||
Video Ad Duration |
AverageQuality Score |
Quality Score 7-10Count of Ads |
Quality Score 4-6Count of Ads |
Quality Score 0-3Count of Ads |
0 - 15 |
6 |
10 |
25 |
3 |
16 - 30 |
5 |
0 |
7 |
1 |
Summertime 2020 QSR Video AdsRanked By Realeyes Quality ScoreU.S. General Population SampleTested June 17-24, 2020 |
||||||||
|
|
Video name |
Brand |
Duration (Sec) |
Quality Score |
Performance |
Time To First Distraction (Sec) |
Audience Retention by Second 15 |
Attention Potential(1-100) |
1 |
Summer BLIZZARD Treat Menu-DQ |
Dairy Queen |
14 |
8 |
High |
5.8 |
29% |
72 |
2 |
Summer Blizzard Treat Menu |
Dairy Queen |
9 |
8 |
High |
6.1 |
41% |
70 |
3 |
Stay Home of the Whopper |
Burger King |
15 |
8 |
High |
5.8 |
23% |
87 |
4 |
Johnstown Breakfast is here! |
Wendy's |
10 |
8 |
High |
5.5 |
37% |
69 |
5 |
Friends - Chalupa Cravings Box |
Taco Bell |
14 |
8 |
High |
5.5 |
26% |
81 |
6 |
Safely Serving You |
Taco Bell |
14 |
7 |
High |
5.5 |
31% |
45 |
7 |
Like Childhood Batter - Shakes-Sonic |
Sonic |
14 |
7 |
High |
7.4 |
31% |
16 |
8 |
Spicy hot meets Icy cold |
McDonald's |
15 |
7 |
High |
5.2 |
26% |
75 |
9 |
Still the Same McDonald's |
McDonald's |
14 |
7 |
High |
4.9 |
27% |
89 |
10 |
Dairy Queen - DIY Waterpark |
Dairy Queen |
15 |
7 |
High |
5.1 |
27% |
64 |
11 |
Johnstown Breakfast is Here! |
Wendy's |
10 |
6 |
Mid |
4.8 |
30% |
95 |
12 |
All That Together -Chicken Slinger |
Sonic |
14 |
6 |
Mid |
5.1 |
24% |
83 |
13 |
Lights On - McDonald's |
McDonald's |
29 |
6 |
Mid |
5.1 |
24% |
67 |
14 |
EXTRAMOST BESTEST Pizza |
Little Caesars |
14 |
6 |
Mid |
5.2 |
23% |
76 |
15 |
Thank you - Little Caesars |
Little Caesars |
14 |
6 |
Mid |
4.9 |
25% |
75 |
16 |
Summer BLIZZARD Treat Menu-DQ |
Dairy Queen |
29 |
6 |
Mid |
5.1 |
24% |
67 |
17 |
Stay Home of the Whopper |
Burger King |
15 |
6 |
Mid |
5.1 |
23% |
64 |
18 |
Burger King - We're Open |
Burger King |
14 |
6 |
Mid |
5.1 |
26% |
63 |
19 |
Burger King - We're Open |
Burger King |
9 |
6 |
Mid |
5.0 |
41% |
52 |
20 |
Pecan Chicken Salad - Last Year |
Arby's |
14 |
6 |
Mid |
4.3 |
25% |
83 |
21 |
Brownie & Yellow Cake Batter Shakes |
Sonic |
14 |
6 |
Mid |
4.1 |
24% |
75 |
22 |
Try Something Different |
Pizza Hut |
14 |
5 |
Mid |
5.8 |
24% |
20 |
23 |
Most Important Meals |
McDonald's |
29 |
5 |
Mid |
4.4 |
21% |
76 |
24 |
An Honor |
McDonald's |
29 |
5 |
Mid |
5.1 |
25% |
45 |
25 |
Cell 4-Wherever You Live- McDonald's |
McDonald's |
14 |
5 |
Mid |
4.3 |
25% |
65 |
26 |
McDonalds App |
McDonald's |
7 |
5 |
Mid |
4.7 |
40% |
92 |
27 |
Daredevil-Stuffed Crazy Bread |
Little Caesars |
14 |
5 |
Mid |
4.5 |
21% |
79 |
28 |
Bright Side-Domino's Pizza |
Domino's Pizza |
29 |
5 |
Mid |
5.1 |
12% |
74 |
29 |
Dominoes - Mix Match |
Domino's Pizza |
9 |
5 |
Mid |
4.7 |
32% |
82 |
30 |
Safety & In-Restaurant Procedures |
Burger King |
29 |
5 |
Mid |
4.8 |
24% |
36 |
31 |
Our Kitchen to Yours – At-Home Taco Bar |
Taco Bell |
14 |
4 |
Mid |
3.7 |
23% |
77 |
32 |
Give Your Oven the Night Off |
Pizza Hut |
14 |
4 |
Mid |
3.9 |
20% |
86 |
33 |
New Black Pepper Angus Steak |
Panda Express |
29 |
4 |
Mid |
4.7 |
18% |
47 |
34 |
Happy Kid Happy Parent |
McDonald's |
14 |
4 |
Mid |
5.2 |
21% |
38 |
35 |
Tomorrow Brings More - Wendy's Breakfast |
Wendy's |
30 |
3 |
Lowo |
3.7 |
22% |
49 |
36 |
First Date- Chicken Slinger |
Sonic |
14 |
3 |
Low |
3.5 |
19% |
45 |
37 |
COVID-19 Phase 2 Procedures |
Burger King |
14 |
3 |
Low |
3.7 |
22% |
33 |
38 |
Burger King - 100% Whopper, 0% Beef |
Burger King |
8 |
3 |
Low |
4.3 |
38% |
41 |
Definitions
Quality Score: Realeyes composite score indicating how strong a video asset is at capturing attention. It is determined according to the following three key indicators.
Time to First Distraction: The seconds that viewers are attentive from the start of the video, until first distraction.
Audience Retention by Second 15: The percent of the audience likely to stay attentive to the video for up to 15 seconds of viewing.
Attention Potential (1-100): The strength of the video to generate high engagement, including attentiveness and emotional peaks relative to the video's category benchmark. Higher Attention Potential indicates viewers are more likely to report being interested the video.
Get the Report
