Super Bowl LV Live Ad Tracker for Attention Using Emotion AI

Colin Pye
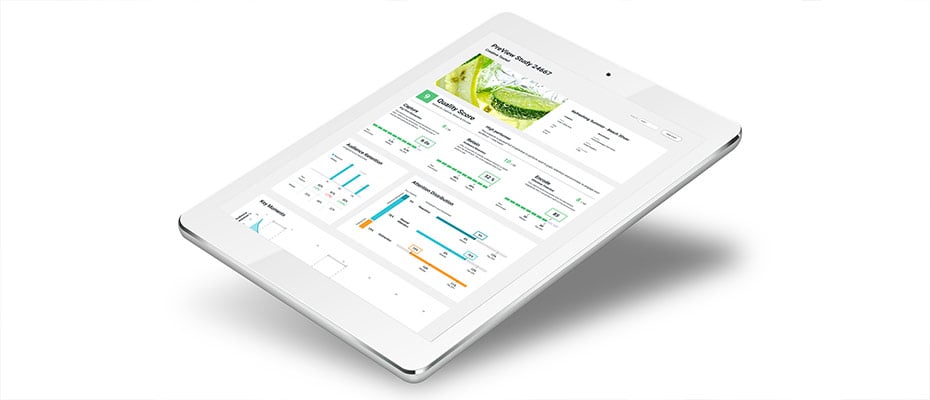
From the first to the last ad of the game, each spot released in the field is rated by its performance to Capture, Retain and Encode audience attention using PreView.
| Brand | Creative | Duration | Score | Capture | Retain | Encode | ||||||||||
| T-Mobile | Family Drama | 1:00 | 9 | 6.55 | 28% | 93 | ||||||||||
| Amazon Prime | Coming to America II | 0:30 | 7 | 5.37 | 24% | 65 | ||||||||||
| H&R Block | File Virtually | 00:30 | 7 | 5.07 | 23% | 65 | ||||||||||
| Inspiration4 | Join The First All-Civilian Space Mission |
0:30 | 7 | 5.51 | 26% | 80 | ||||||||||
| NFL | As One | 1:00 | 7 | 5.27 | 25% | 78 | ||||||||||
| Nintendo Switch | Awkwafina plays... Mario Kart 8 Deluxe | 0:30 | 7 | 5.09 | 24% | 71 | ||||||||||
| Rocket Mortgage | Certain is Better | 1:00 | 7 | 5.05 | 23% | 65 | ||||||||||
| 5-Second Ad | 0:05 | 7 | 5.00 | 50% | 53 | |||||||||||
| Michelob Ultra | All-Star Cast | 1:00 | 6 | 6.41 | 29% | 92 | ||||||||||
| Mountain Dew | Mtn Dew Major Melon Bottle Count | 0:30 | 6 | 4.65 | 22% | 58 |
||||||||||
| Oatly | Wow No Cow | 0:35 | 6 | 5.27 | 25% | 77 |
||||||||||
| P&G | Come Clean to Close the Chore Gap | 0:30 | 6 | 5.54 | 27% | 86 |
||||||||||
| Scotts & Miracle Gro | Keep Growing | 0:46 | 6 | 4.08 | 23% | 60 |
||||||||||
| Amazon Alexa | Alexa’s Body | 1:00 | 5 | 4.65 | 23% | 52 | ||||||||||
| Bud Light Seltzer | Last Year's Lemons | 1:00 | 5 | 4.16 | 22% | 63 | ||||||||||
| Paramount | Coming 2 America Official Trailer | 1:35 | 5 | 4.23 | 14% | 51 | ||||||||||
| Doritos | #FlatMatthew | 1:00 | 5 | 5.37 | 22% | 56 |
||||||||||
| E-Trade | Workout | 0:30 | 5 | 4.79 | 21% | 53 |
||||||||||
| Funky Buddha | Funky The Ordinary | 0:30 | 5 | 5.88 | 3% | 14 |
||||||||||
| M&M's | M&M’S ft. Dan Levy | 0:30 | 5 | 5.11 | 26% | 79 | ||||||||||
| Universal Studios | OLD (Trailer) | 0:30 | 5 | 3.87 | 16% | 56 |
||||||||||
| Skechers | To the Max | 0:30 | 5 | 5.59 | 25% | 81 |
||||||||||
| Squarespace | 5 to 9 by Dolly Parton | 1:00 | 5 | 5.59 | 22% | 57 | ||||||||||
| State Farm | Drake From State Farm | 0:30 | 5 | 4.33 | 23% | 61 | ||||||||||
| Tide | The Jason Alexander Hoodie - | 1:00 | 5 | 5.05 | 22% | 54 | ||||||||||
| T-Mobile | Rockstar 5G | 1:00 | 5 | 3.87 | 18% | 36 | ||||||||||
| Turbotax | Spreading Tax Expertise Across the Land | 0:45 | 5 | 4.77 | 21% | 54 | ||||||||||
| Cheetos | It Wasnt Me | 1:00 | 4 | 4.06 | 21% | 49 | ||||||||||
| Dexcom | Rant ft. Nick Jonas | 0:30 | 4 | 4.53 | 22% | 64 | ||||||||||
| Disney+ | Get Your Stream On | 0:30 | 4 | 4.45 | 0% | 8 |
Definitions
Quality Score
Realeyes composite score indicating how strong a video asset is at capturing attention. It is determined according to the following three key indicators.
Capture: The seconds that viewers are attentive from the start of the video, until the first distraction.
Retain: The percent of the audience likely to stay attentive to the video for up to 15 seconds of viewing.
Encode: The strength of the video to generate high engagement, including attentiveness and emotional peaks relative to the video's category benchmark. Higher Attention Potential indicates viewers are more likely to report being interested in the video.
Methodology
Realeyes measures naturally occurring human response using front-facing cameras as 150 opt-in US viewers watch the ads from their PCs, laptops, mobile phones and tablets. No opinions or analysis, just the score that matters.
The Quality Score used in this leaderboard is part of Realeyes' PreView product, a content intelligence tool for predicting and managing attention in advertising. PreView allows advertisers to reduce media waste by predicting and eliminating low-performing video creative and boosting strong attentive creative. PreView has achieved up to 30% performance gains and 9X return of investment based on an ROI model involving 51 actual consumer goods ads


