
The Best Super Bowl Ads for Audience Attention 2018 - 2020

Colin Pye
All eyes are on the Super Bowl. The biggest network TV event of the year claimed 102 million viewers in 2020 at a cost of $5.6 million per 30-seconnd spot. But are advertisers creating ads that engage with viewers and connect with them on an emotional level?
Realeyes set out to understand trends in Super Bowl advertising over the last three years by testing 192 ads that aired during the big game in 2018, 2019, and 2020. All ads were tested with our PreView system, which measures the ability of an ad to capture and retain viewer attention and encode an emotional response.
Super Bowl LV will be occurring in a vastly different environment than previous years. Viewers have been through an emotional roller coaster over the last year with the COVID-19 pandemic and a hotly contested election.
Overall our study found a decline quality and encoding scores over the last three years, which may be indicative of emotional fatigue in an increasingly divided nation. After a rocky January, in 2021all bets are off as to the ability of advertisers to capture viewer attention and connect with them on an emotional level. Stay tuned for our Super Bowl LV Recap after the game.
Data Highlights from 2018-2020
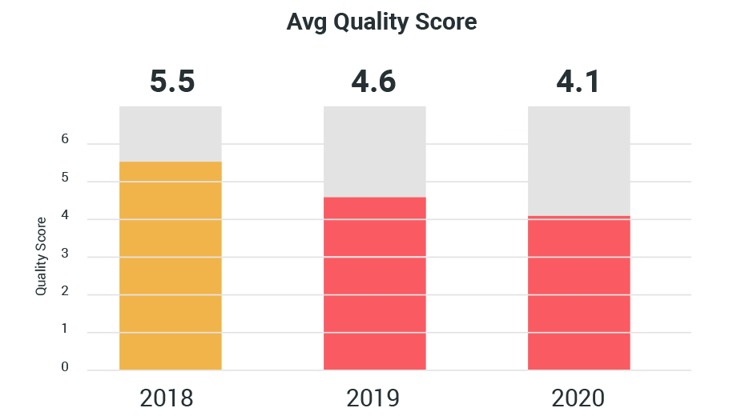
Average Quality scores for Super Bowl ads were 25% lower in 2020 compared to 2018. Encoding scores were 28% lower in 2020 compared to 2018. Viewers were slightly more distractable in 2020 compared to 2020: average capture scores dropped by 8% in 2020 compared to 2018.
When looking at Quality Scores across categories, the beverage category had the highest average quality scores in 2018 and 2020. A Bud Light ad appeared in the Top 10 all three years.
Ad length was not a significant factor in ad ad’s ability to garner a high Quality Score; top-performing ads were seen across 15, 30, and 60 and even longer ads in all years.
| Overall Average Scores by Year | 2018 | 2019 | 2020 |
| Quality Score (0-10) | 5.5 | 4.6 | 4.1 |
| Capture: Avg First Distraction (second) | 4.5 | 4.7 | 4.2 |
| Retain: Audience Retention by Second 15 | 22% | 16% | 19% |
| Encode (0-100) | 76.2 | 60.3 | 54.7 |
| Average Quality Score by Category | 2018 | 2019 | 2020 |
| Automotive | 5.0 | 3.7 | 3.3 |
| Beverages | 6.0 | 4.8 | 4.6 |
| Food and confectionery | 5.8 | 5.0 | 4.4 |
| Telecom, internet services and ISP | 5.7 | 3.8 | 3.8 |
| Average Quality Score by Duration | 2018 | 2019 | 2020 |
| 15 seconds or less | 5.3 | 5.5 | 4.0 |
| 30 seconds | 5.5 | 4.6 | 4.2 |
| 60 seconds | 5.5 | 4.3 | 4.1 |

Super Bowl 2018 - LII
| Brand | Creative | Sec | Quality Score | Capture | Retain | Encode | ||
| 1 | Persil | Game Time Stain Time | 30 | 8 | 5.54 | 37% | 80 | |
| 2 | Turbotax | The Noise in the Attic | 30 | 8 | 5.79 | 28% | 69 | |
| 3 | Doritos | DORITOS BLAZE vs. MTN DEW ICE - ft. Peter Dinklage and Morgan Freeman | 60 | 8 | 5.59 | 23% | 99 | |
| 4 | NFL Network | Touchdown Celebrations to Come | 60 | 8 | 5.51 | 25% | 99 | |
| 5 | Amazon Alexa | Alexa Loses Her Voice | 90 | 8 | 5.86 | 29% | 97 | |
| 6 | Skittles | Skittles Teasers 2018 - Video 3 | 15 | 7 | 5.37 | 22% | 99 | |
| 7 | E-Trade | This Is Getting Old | 30 | 7 | 5.05 | 21% | 99 | |
| 8 | Universal Parks | Vacation Quarterback | 60 | 7 | 5.64 | 24% | 75 | |
| 9 | Michelob Ultra |
I Like Beer | 630 | 7 | 5.05 | 25% | 75 | |
| 10 | Bud Light | Ye Olde Pep Talk | 30 | 7 | 5.37 | 27% | 70 |

Super Bowl 2019 - LIII
| Brand | Creative | Sec | Quality Score | Capture | Retain | Encode | ||
| 1 | Bud Light | Trojan Horse Occupants | 15 | 8 | 7.51 | 34% | 53 | |
| 2 | M&Ms | Bad Passengers ft. Christina Applegate | 30 | 8 | 7.50 | 23% | 99 | |
| 3 | Bumble | The Ball is in Your Court ft. Serena Williams | 30 | 8 | 6.55 | 22% | 92 | |
| 4 | Microsoft | We All Win | 60 | 8 | 6.75 | 28% | 80 | |
| 5 | NFL | The 100 Year Game | 120 | 8 | 4.65 | 30% | 94 | |
| 6 | Colgate | Total SF - So Close | 30 | 7 | 7.23 | 16% | 89 | |
| 7 | Wix.com | Karlie Kloss | 30 | 7 | 6.33 | 30% | 32 | |
| 8 | Persil | Deepest Stains | 15 | 6 | 5.72 | 29% | 13 | |
| 9 | Dietz & Watson |
Craig Robinson Likes Dietz Nuts | 30 | 6 | 4.53 | 21% | 96 | |
| 10 | Olay | Killer Skin | 30 | 6 | 5.27 | 8% | 95 |

Super Bowl 2020 - LIV
| Brand | Creative | Sec | Quality Score | Capture | Retain | Encode | ||
| 1 | Paramount Pictures | A Quiet Place Part II | 30 | 9 | 6.07 | 25% | 93 | |
| 2 | Mountain Dew | Zero Sugar - As Good As The Original | 30 | 7 | 5.30 | 21% | 97 | |
| 3 | McDonald's | Famous Orders | 30 | 7 | 5.54 | 23% | 91 | |
| 4 | Fast & Furious | Fat & Furious (Trailer) | 30 | 7 | 4.86 | 18% | 82 | |
| 5 | T-Mobile | Anthony Anderson's Mama Tests T-Mobile's 5G Network | 60 | 7 | 4.65 | 26% | 87 | |
| 6 | Bud Light | Seltzer - Post Malone | 60 | 7 | 5.86 | 22% | 69 | |
| 7 | Discover | No We Don;t Charge Annual Fees | 15 | 6 | 4.86 | 23% | 80 | |
| 8 | Minions | The Rise of Gru (Trailer) | 30 | 6 | 4.27 | 18% | 94 | |
| 9 | Hint Water |
CPie Eating Contest | 30 | 6 | 4.53 | 24% | 84 | |
| 10 | Snickers | Fix the World | 30 | 6 | 5.05 | 25% | 56 |
Definitions
Quality Score
Realeyes composite score indicating how strong a video asset is at capturing attention. It is determined according to the following three key indicators.
Capture: The seconds that viewers are attentive from the start of the video, until the first distraction.
Retain: The percent of the audience likely to stay attentive to the video for up to 15 seconds of viewing.
Encode: The strength of the video to generate high engagement, including attentiveness and emotional peaks relative to the video's category benchmark. Higher Attention Potential indicates viewers are more likely to report being interested in the video.

Methodology
Realeyes measures naturally occurring human response using front-facing cameras as opt-in viewers watch the ads from their PCs, laptops, mobile phones and tablets. Each Super Bowl study included an average of 70 videos, over 200 participant viewers per video, with a total of c.2,500 views.
The Quality Score used in this study is part of Realeyes' PreView product, a content intelligence tool for predicting and managing attention in advertising. PreView allows advertisers to reduce media waste by predicting and eliminating low-performing video creative and boosting strong attentive creative. PreView has achieved up to 30% performance gains and 9X return of investment based on an ROI model involving 51 actual consumer goods ads
Super Bowl Ad Tracker
From the teasers through to the last ad of the game, each spot released is rated by its performance to Capture, Retain and Encode audience attention using Realeyes PreView.
